Insights & Analytics
Track onboarding completion, feedback volume, and user activity.
The Insights section in your dashboard gives you visibility into how users interact with your onboarding and feedback.
Overview (Insights > Overview)
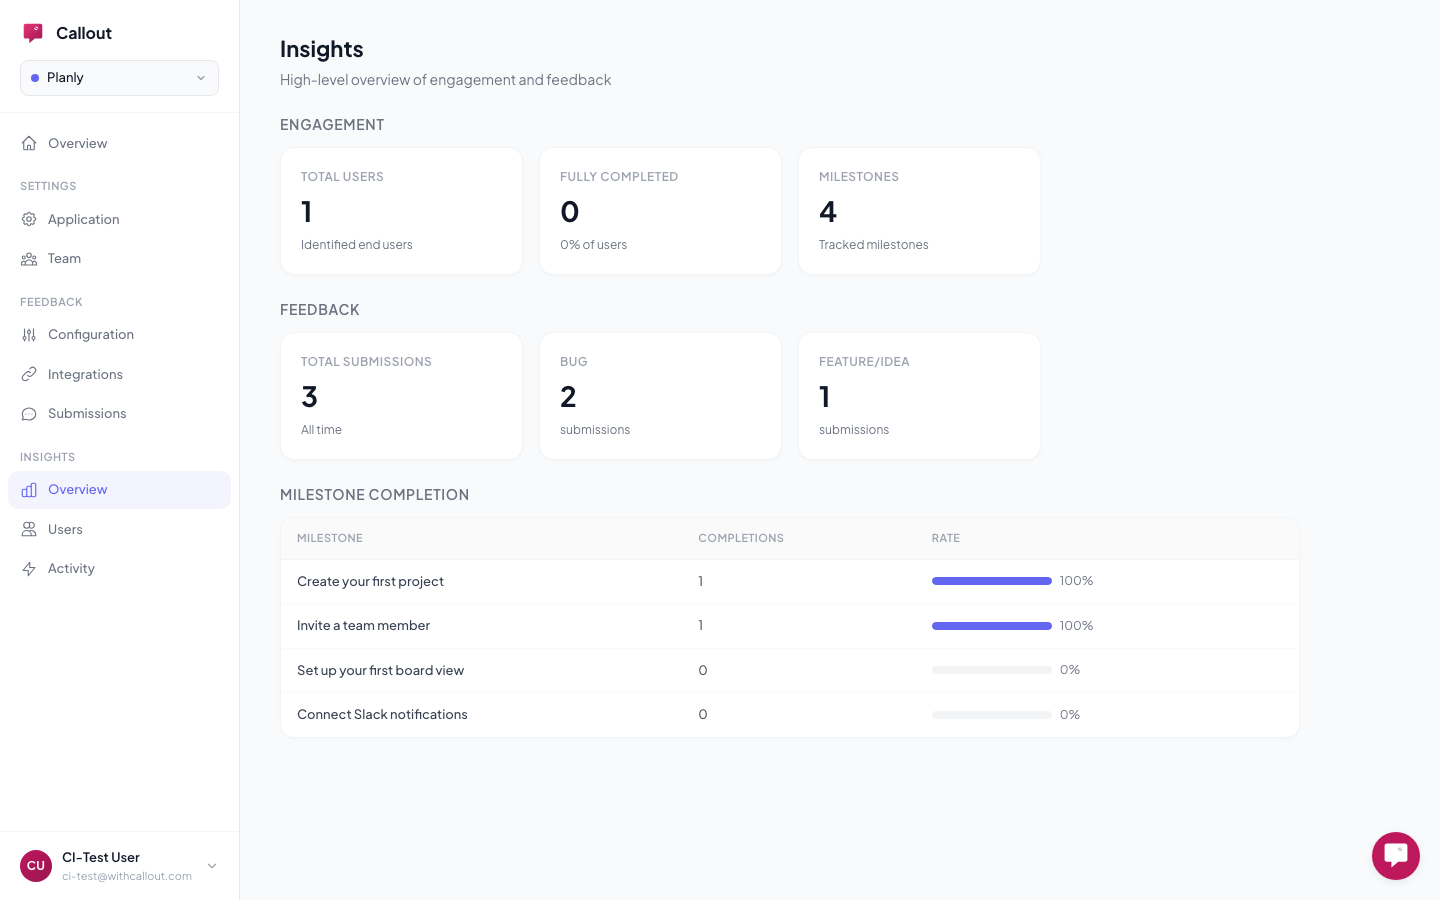
The overview dashboard shows your key metrics at a glance:
Engagement:
- Total identified users — how many users Callout has seen
- Fully completed — users who finished all active milestones
- Completion rate — the percentage who completed everything
Feedback:
- Total submissions — all-time bug reports and feature requests
- Reports by category — breakdown by Bug, Feature Request, Question, etc.
Milestone completion table — see each milestone's completion count and rate, with a progress bar so you can spot exactly where users drop off.
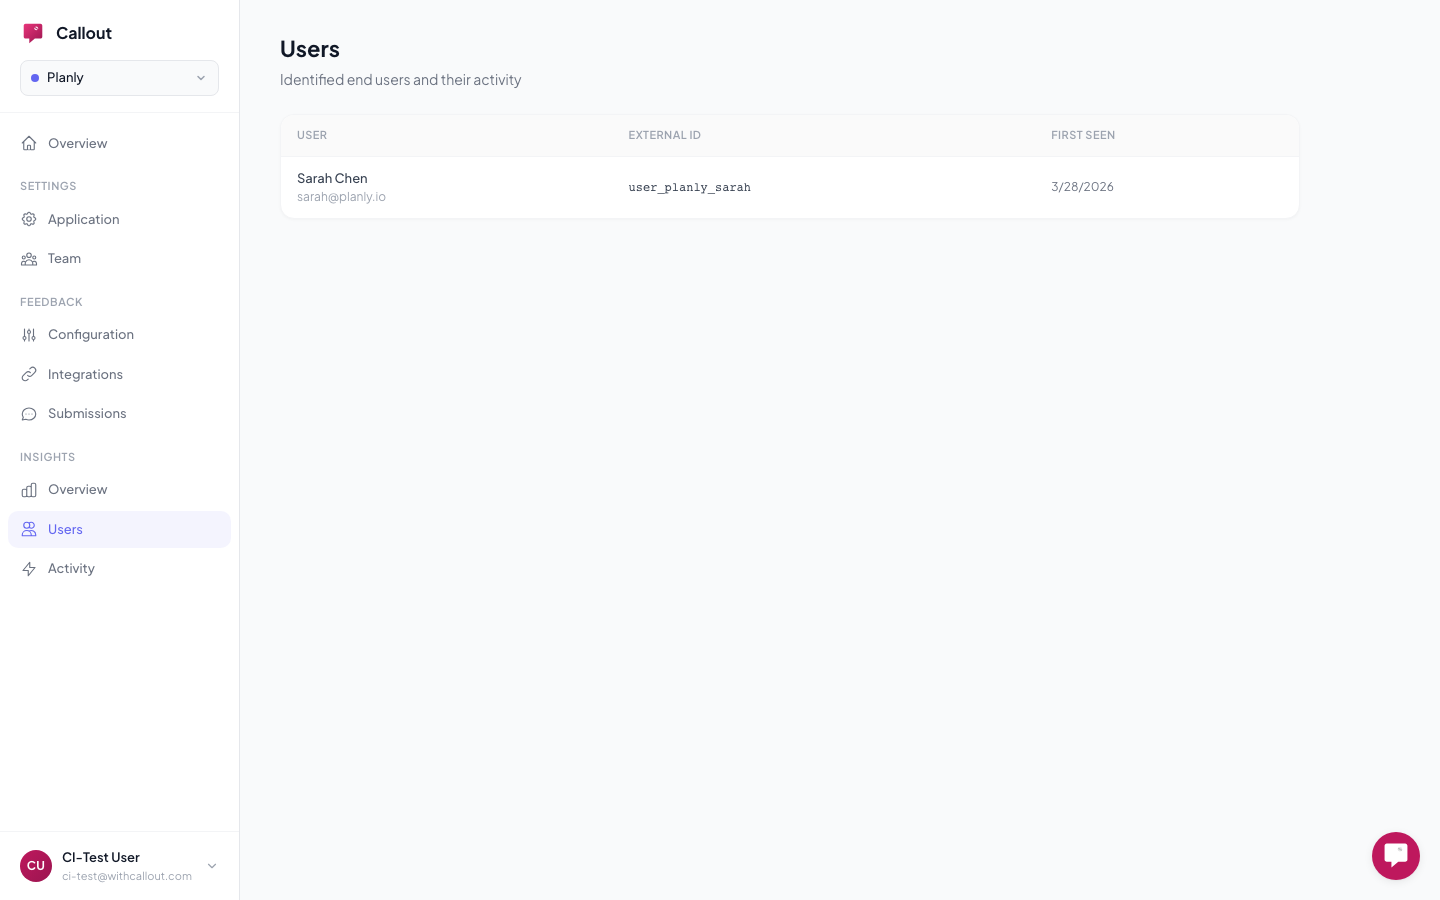
Users (Insights > Users)
Browse all identified users with their details:
- Name, email, and external ID
- Custom traits they've sent
- Milestone completion status and progress
Click any user to open their detail view, which shows a timeline of everything they've done — onboarding events (tour completed, milestone reached, banner dismissed) and feedback submissions — merged chronologically so you can see the full picture.
This is useful for following up with a specific reporter, understanding why someone is stuck in onboarding, or checking whether a power user is engaging with your tours.
Activity Log (Insights > Activity)
A chronological log of every event across all users:
- Views — which experiences were shown
- Completions — tours completed, milestones reached
- Dismissals — tours dismissed, banners closed
- Feedback — bug reports and feature requests submitted
Each entry shows the event type, experience name, user, and timestamp. Click a user or experience to jump to its detail page.
Related
- Checklists — create milestones to track
- Identity & Traits — how users are identified for tracking
- Segments — target experiences to specific audiences